Plotting a Gaussian normal curve with Python and Matplotlib

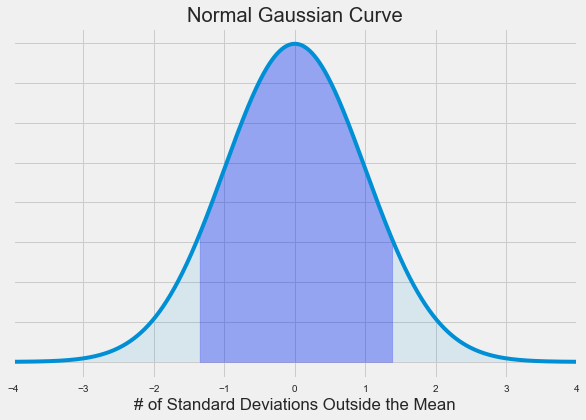
In the previous post, we calculated the area under the standard normal curve using Python and the erf() function from the math module in Python's Standard Library. In this post, we will construct a plot that illustrates the standard normal curve and the area we calculated. To build the Gaussian …
 A quiver plot is a type of 2D plot that shows vector lines as arrows. Quiver plots are useful in electrical engineering to visualize electrical potential and valuable in mechanical engineering to show stress gradients. In this post, we will build three quiver plots using Python, matplotlib, numpy, and Jupyter notebooks.
 After watching a great webinar about plotting with different python libraries, I wanted to see what it was like to make a stress strain curve using four different modules: pandas, matplotlib, altair and bokeh (with holoviews).
