How to make y-y plots with Matplotlib
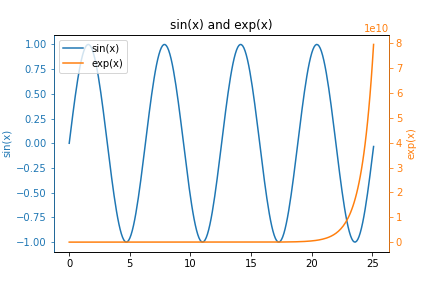
In this post, you will learn how to create y-y plots with Python and Matplotlib. y-y plots are a type of line plot where one line corresponds to one y-axis and another line on the same plot corresponds to a different y-axis. y-y plots typically have one vertical y-axis on …


 A quiver plot is a type of 2D plot that shows vector lines as arrows. Quiver plots are useful in electrical engineering to visualize electrical potential and valuable in mechanical engineering to show stress gradients. In this post, we will build three quiver plots using Python, matplotlib, numpy, and Jupyter notebooks.