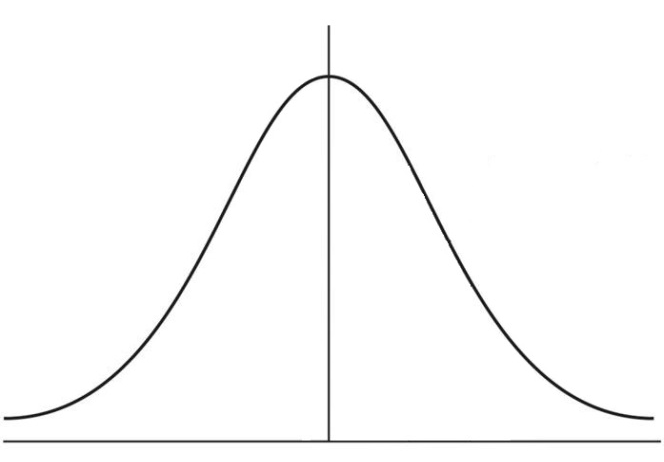
Calculate the Probability Under a Normal Curve

gaussian_curve

Calculating the probability under a normal curve is useful for engineers. This type of calculation can be helpful to predict the likely hood of a part coming off an assembly line being within a given specification. The probability can be calculated when the statistical properties of all the parts that …

more ...


Statistics in Python using the statistics module

In this post, we'll look at a couple of statistics functions in Python. These statistics functions are part of the Python Standard Library in the statistics module. The four functions we'll use in this post are common in statistics:

  • mean - average value
  • median - middle value
  • mode - most often value
  • standard …
more ...

Bar charts with error bars using Python, jupyter notebooks and matplotlib

Bar charts with error bars are useful in engineering to show the confidence or precision in a set of measurements or calculated values. Bar charts without error bars give the illusion that a measured or calculated value is known to high precision or high confidence. In this post, we will build a bar plot using Python, the statistics module and matplotlib. The plot will show the tensile strength of two different 3-D printer filament materials, ABS and HIPS. We will then add error bars to the plot based on the standard deviation of the data.

more ...