Python for Undergraduate Engineers
  • About
  • Book
  • Gear
  • Now
  • Archives
  1. Tags
  2. scipy

Plotting a Gaussian normal curve with Python and Matplotlib
Date Sat 02 February 2019 Tags python / engineering / statistics / matplotlib / scipy

Area Under Normal Curve Plot

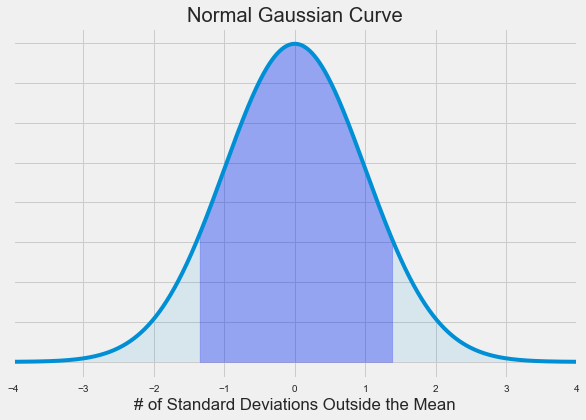
In the previous post, we calculated the area under the standard normal curve using Python and the erf() function from the math module in Python's Standard Library. In this post, we will construct a plot that illustrates the standard normal curve and the area we calculated. To build the Gaussian …

more ...

About Peter Kazarinoff
I teach engineering at a community college in the Pacific Northwest. I am interested in programming and how to help students. Here I mostly blog about Python, and how programing can be incorporated into engineering education.

  • Recent Posts

    • Plotting a Gaussian normal curve with Python and Matplotlib
  • Tags

    • engineering
    • flask
    • jupyter
    • jupyter notebook
    • matplotlib
    • microcontroller
    • micropython
    • pelican
    • python
    • sensor
  • GitHub Repos

    Status updating...

    @professorkazarinoff on GitHub

© 2019 Peter Kazarinoff · Powered by pelican-bootstrap3, Pelican, Bootstrap

Back to top