Solving a Circuit Diagram Problem with Python and SchemDraw
In this post we will solve a circuit diagram problem using a Python package called SchemDraw 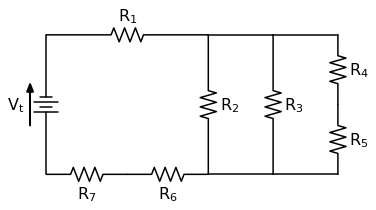
In this post we will solve a circuit diagram problem using a Python package called SchemDraw
I was working on an engineering problem involving diffusion that involved a couple of different units including joules, grams, kilograms, meters, centimeters, moles, megapascals and weight percent. To make sure that I kept track of all the units and unit conversions throughout the problem, I thought I'd try using pint, a Python package for unit conversions.
more ...Bar charts with error bars are useful in engineering to show the confidence or precision in a set of measurements or calculated values. Bar charts without error bars give the illusion that a measured or calculated value is known to high precision or high confidence. In this post, we will build a bar plot using Python, the statistics module and matplotlib. The plot will show the tensile strength of two different 3-D printer filament materials, ABS and HIPS. We will then add error bars to the plot based on the standard deviation of the data.
more ...Units and unit conversions are BIG in engineering. Engineers solve the world's problems in teams. Any problem that is solved has to have a context that it is solved in. How heavy can a rocket be and still make it off the ground? What thickness body panels should be used to keep occupants save during a crash? In engineering, a number without a unit is like a fish without water. It just flops around hopelessly without context and is useless. How can we get help using units? Programming is one way. In this post, we are going to use Python and Pint, a python package used for unit conversions, to do a couple of sample unit conversion problems.
more ...Bar charts with error bars are useful in engineering to show the confidence or precision in a set of measurements or calculated values. Bar charts without error bars give the illusion that a measured or calculated value is known to high precision or high confidence. In this post, we will build a bar plot using Python and matplotlib. The plot will show the coefficient of thermal expansion (CTE) of three different materials based on a small data set. Then we'll add error bars to this chart based on the standard deviation of the data.
more ...