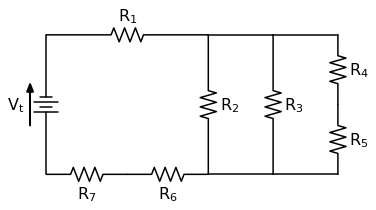
Solving a Circuit Diagram Problem with Python and SchemDraw
In this post we will solve a circuit diagram problem using a Python package called SchemDraw 
In this post we will solve a circuit diagram problem using a Python package called SchemDraw 
Bar charts with error bars are useful in engineering to show the confidence or precision in a set of measurements or calculated values. Bar charts without error bars give the illusion that a measured or calculated value is known to high precision or high confidence. In this post, we will build a bar plot using Python, the statistics module and matplotlib. The plot will show the tensile strength of two different 3-D printer filament materials, ABS and HIPS. We will then add error bars to the plot based on the standard deviation of the data.
more ...Bar charts with error bars are useful in engineering to show the confidence or precision in a set of measurements or calculated values. Bar charts without error bars give the illusion that a measured or calculated value is known to high precision or high confidence. In this post, we will build a bar plot using Python and matplotlib. The plot will show the coefficient of thermal expansion (CTE) of three different materials based on a small data set. Then we'll add error bars to this chart based on the standard deviation of the data.
more ...