Python for Undergraduate Engineers
  • About
  • Book
  • Gear
  • Now
  • Archives
  1. Categories
  2. matplotlib

How to add an Inset Curve with Matplotlib and Python

Date Tue 02 November 2021 Tags python / matplotlib / engineering / jupyter / notebook

stress strain curve

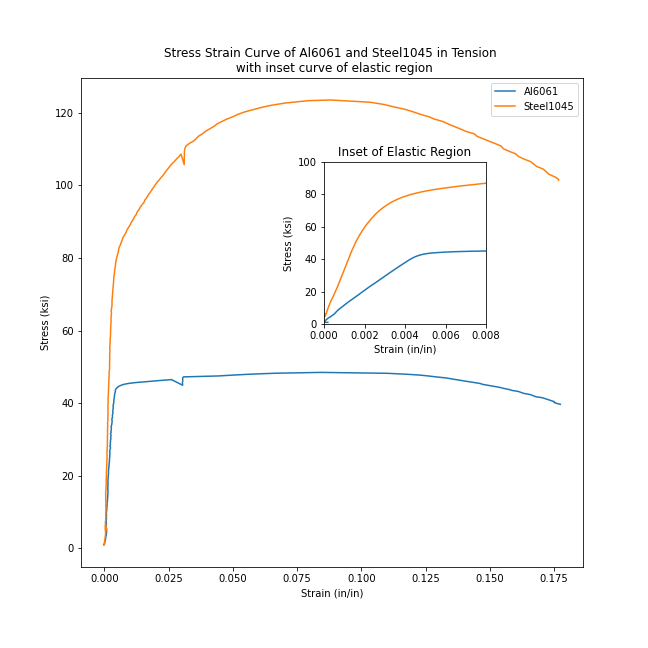
In this post, you'll see how to add an inset curve to a Matplotlib plot. An inset curve is a small plot laid on top of a main larger plot. The inset curve is smaller than the main plot and typically shows a "zoomed in" region of the main plot …

more ...

Crank and Rocker Motion with Python and Matplotlib

Date Mon 27 September 2021 Tags python / matplotlib / animation

crank and rocker still

Crank and rocker motion is one of the classic types of motion that belongs to a category of 4-bar motion. Crank and rocker motion is the type of motion that a pumpjack goes through when pumping a fluid. In this post, you'll learn how to create an animation of crank …

more ...

How to make animated plots with Matplotlib and Python

Date Sun 02 May 2021 Tags python / matplotlib / animation / arduino / api

animated sensor plot

Python and Matplotlib can be used to create static 2D plots. But it Matplotlib can also be used to create dynamic auto-updating animated plots. In this post, you learn how to create a live auto-updating animated plot using Python and Matplotlib.

Table of contents:
  • Pre-requisits
  • Set up a Python virtual …
more ...

Offset Piston Motion with Python and Matplotlib

Date Thu 22 April 2021 Tags python / matplotlib / animation / engineering

Offset piston motion still

Offset piston motion is one of the classic types of engineering dynamics motion that belong to a category of 4-bar motion. Piston motion is the type of motion that the piston in a cylinder of a car engine goes through as the crankshaft rotates.

Offset piston motion has the same …

more ...

How to make y-y plots with Matplotlib

Date Tue 02 March 2021 Tags python / matplotlib / engineering / plotting / jupyter notebook

yy-plot

In this post, you will learn how to create y-y plots with Python and Matplotlib. y-y plots are a type of line plot where one line corresponds to one y-axis and another line on the same plot corresponds to a different y-axis. y-y plots typically have one vertical y-axis on …

more ...

  • «
  • 1
  • 2
  • 3
  • »

About Peter Kazarinoff
I teach engineering at a community college in the Pacific Northwest. I am interested in programming and how to help students. Here I mostly blog about Python, and how programing can be incorporated into engineering education.

  • Recent Posts

    • How to add an Inset Curve with Matplotlib and Python
    • Crank and Rocker Motion with Python and Matplotlib
    • How to make animated plots with Matplotlib and Python
  • Tags

    • engineering
    • flask
    • jupyter
    • jupyter notebook
    • matplotlib
    • microcontroller
    • micropython
    • pelican
    • python
    • sensor
  • GitHub Repos

    Status updating...

    @professorkazarinoff on GitHub

© 2021 Peter Kazarinoff · Powered by pelican-bootstrap3, Pelican, Bootstrap

Back to top