
This post contains the top 5 Python for Undergraduate Engineers (this blog) posts of 2019. These posts are ranked in terms of the number of page views. Of the 15 blog posts published on this site in 2019, these five posts were the most popular.
#5. Calculating the probability under a normal curve with Python
The fifth most popular post of 2019 was about how to calculate the probability under a standard normal curve with Python. In the post, we utilized Python's math module, specifically the erf() and sqrt() functions. This post showed a good example of using Python and the Python Standard Library to solve an engineering problem.
#4. How to upload .py-files onto an ESP8266 running MicroPython
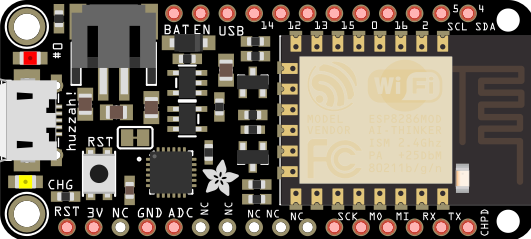
The number four most popular post of 2019 was an update to the sixth part of a multi-part series on Micropython. I had trouble in one of my classes this year uploading a .py-file to an ESP8266 microcontroller running MicroPython using a command-line tool called ampy. There was a trick getting ampy to work on with the ESP8266 microcontroller that I wanted to share in case other people came across the same problem. In the post, I showed how to uploaded upload .py-files to an ESP8266 microcontroller using Python and a Python package called ampy.
#3. Taylor Series in Python
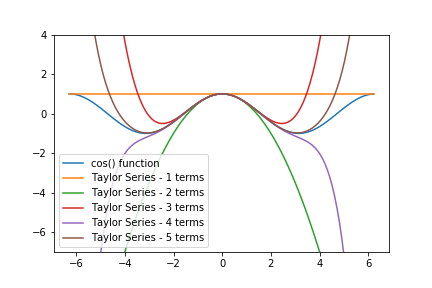
The third most popular post of 2019 showed how to create a Taylor Series with Python and for loops. Then we refactored the Taylor Series script into functions and compared the output of our Taylor Series functions to functions from Python's Standard Library. At the end of the post, a plot of the Taylor Series function was created with Matplotlib to show how the output of the function changed based on the number of terms in the Taylor Series.
#2. Solving Equations and Writing Expressions with SymPy and Python
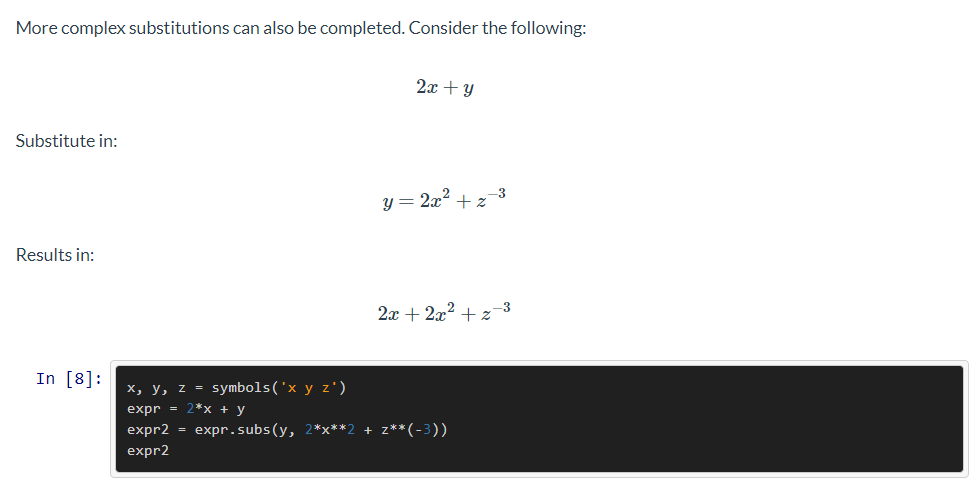
The second most popular post of 2019 was about how to write expressions and equations using Python and a library called SymPy. In this post, we reviewed how to create variables in SymPy and combine these variables into expressions and equations. At the end of the post, we saw to how to solve mathematical equations with SymPy and Python.
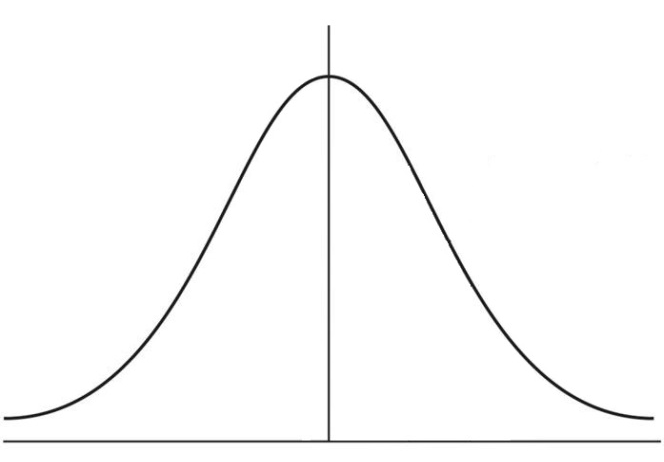
#1. Plotting a Gaussian normal curve with Python and Matplotlib

The top post of 2019 was about how to plot a Gaussian normal curve with Python and Matplotlib. In this post, we constructed a plot that illustrates the standard normal curve and calculated the area under the standard normal curve. To build the Gaussian normal curve, we used Python, Matplotlib, and SciPy.